Dholera Master Plan and Land Price Growth
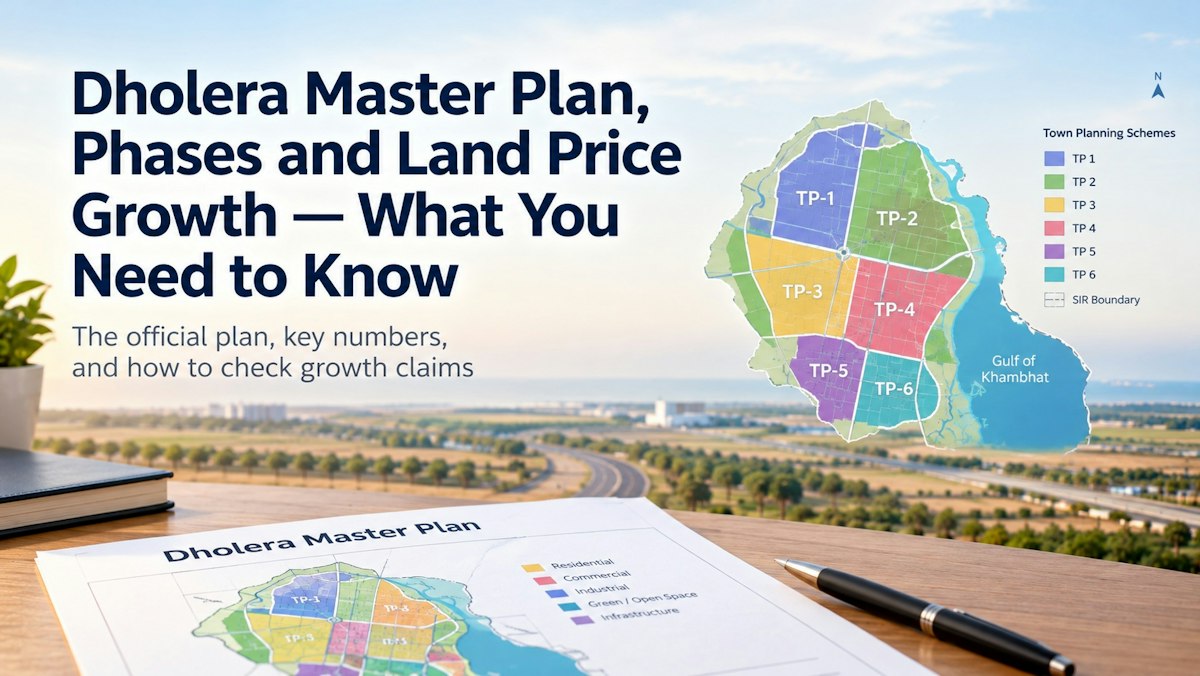
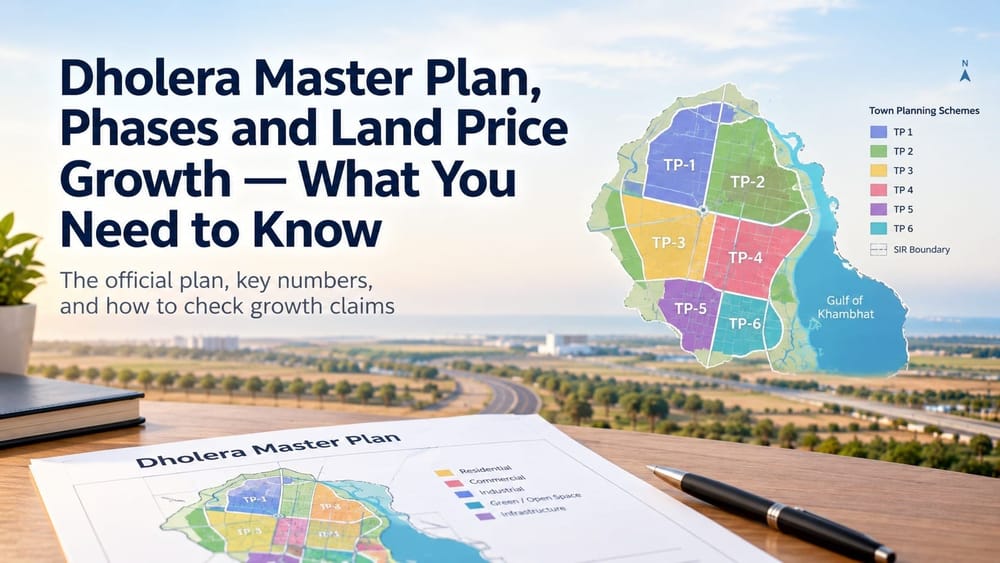
Dholera master plan is a sanctioned, phased plan covering about 920 sq km. It is a long-term framework, and different Town Planning schemes will mature at different times. Dholera land price growth is real in some areas, but no official price index exists, and public claims vary widely. Verify before you rely on any number.
What the Official Master Plan Says
According to the Government of Gujarat’s Dholera portal, the region is envisaged as an incubator city of about 920 sq km, spanning 22 villages of Dholera taluka in Ahmedabad district. The portal adds that the Development Plan has been prepared and sanctioned by DSIRDA, and the developable area is divided into six Town Planning schemes, all of which have been sanctioned in draft form.
Phase-I is smaller than many buyers assume. Phase-I comprises TP 1 and TP 2, covering 153 sq km, with TP 1 at about 51 sq km and TP 2 at about 102 sq km. The city SPV, DICDL, was formed on 28 January 2016, with 51% held by the Government of Gujarat and 49% by the Government of India.
Not all 920 sq km is buildable. A DICDL-sourced summary states that about 580 sq km is developable, since one third of the area falls within the Coastal Regulation Zone.
The five Layers of the Plan, in Plain Language
Layer | What it is | Why it matters to you |
Development Plan | City-wide land-use framework | Shows zones and major roads |
Town Planning scheme (TP 1-6) | Plot-level reorganisation into planned plots and roads | Gives your final plot number |
Zoning | Residential, commercial, industrial and so on | Decides permitted use |
Development regulations (GDCR) | FAR, height, setbacks | Decides what you can build |
Phasing | Order of infrastructure delivery | Affects when services reach your plot |
For help reading plot numbers, see our guide on survey number vs final plot number.
Phases and Your Plot
Because Phase-I is TP 1 and TP 2, plots in other schemes follow later. Our listings sit in two different positions:
Ridhi 249/2 is in Kadipur, TP-1 (within Phase-I).
Ridhi 966/1 and Sidhi 857 are in TP-4B2, Bhangadh (a later-phase scheme).
Neither position is “good” or “bad.” Later-phase areas may have more headroom and longer waiting periods. Match the phase to how long you can hold.
Planning Numbers: treat as long-range
A DICDL planning presentation projects 2.0 million residents and 827 thousand jobs in the region. Other summaries quote a lower population target of around one million. These are long-term planning targets, not forecasts for next year, so read them as direction, not promise.
Land Price Growth
There is no official government price index for Dholera plots. What exists are listing prices, developer claims and a few registered deed values. They disagree.
One property portal shows plot listings at ₹400 per sq ft in Jan-Mar 2019 and ₹900 in Jul-Sep 2026, with quarterly swings in the same table of roughly -18% to +29%. These are asking prices, not registered sales.
Some developer-run websites say land rose from ₹300 per sq yard in 2016 to over ₹10,000, and project that values could double over the next 5 to 7 years.
These two views cannot both be treated as a market record, because they use different locations, plot types and definitions.
Reality Check: What Claimed Multiples Mean Per Year
Claim | Implied annual growth (CAGR) |
2× in 5 years | about 14.9% |
2× in 7 years | about 10.4% |
3× in 4 years | about 31.6% |
30× in 9 years | about 45.9% |
Portal asking prices, 2.25× in 7.5 years | about 11.4% |
Use this table to judge any claim you hear. Annual growth above 30% for years on end is rare for any land market.
How to check growth claims yourself
Ask for the exact plot. Growth in one TP scheme says little about another.
Ask for registered sale deed values. The Sub-Registrar’s records and GARVI searches are the closest thing to a price record.
Compare like with like. Same TP scheme, road width, plot size and use.
Separate asking from sold. A listing is not a transaction.
Check dates. A figure from 2023 says little about 2026.
Calculate CAGR using the table above.
What actually moves price in a phased city
Infrastructure milestones. The Ahmedabad-Dholera Expressway was inaugurated on 31 March 2026. The airport was reported at about 80% complete in July 2026, with operations targeted for September or October.
Anchor investment. The Cabinet approved a Dholera fab with 50,000 wafers per month and ₹91,000 crore of investment.
Local factors. Road width, zoning, phase and title clarity.
Milestones can slip, so no one can promise a price path.
FAQs
What is the Dholera master plan?
A sanctioned Development Plan and six Town Planning schemes managed by DSIRDA.
How much of Dholera is Phase-I?
TP 1 and TP 2, about 153 sq km.
Is there an official Dholera price index?
We did not find one.
Is a 10x rise in a few years realistic?
Check the CAGR. Claims at that level need solid, registered evidence.
Talk to Omana Projects
Call +91 92171 04219 or email customercare@omanaprojects.com for TP-scheme and phase details of our listed plots.